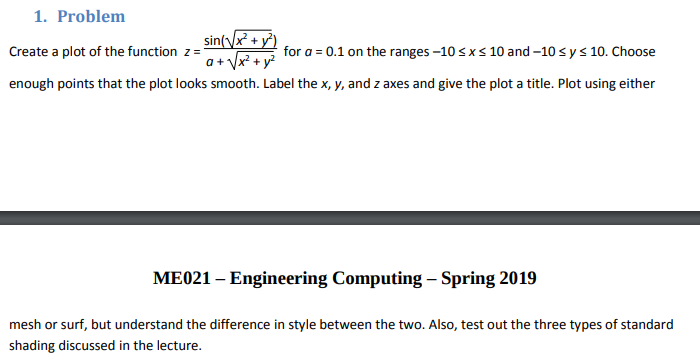
1. Problem Create a plot of the function z- yor a a 0.1 on the ranges-10sxs 10 and-10sy s 10. Choose enough points that the plot looks smooth. Label the x, y, and z axes and give the plot a title. Plot using either ME021 Engineering Computing – Spring 2019 mesh or surf, but understand the difference in style between the two. Also, test out the three types of standard shading
OR
OR
