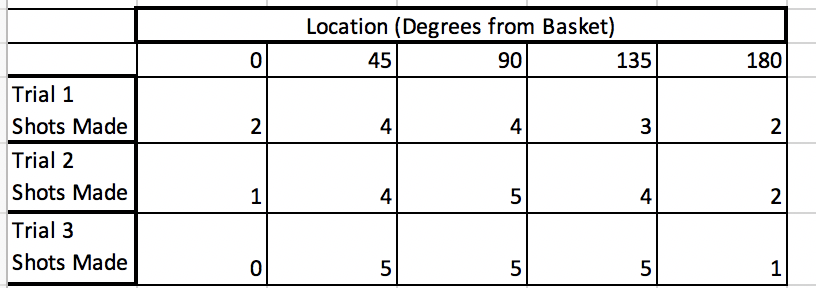
Import this data from excel to matlab and use the data to plotthe trendline for each trial on one plot. From there, calculate theaverage, standard deviation, and percentage of shots made for eachtrial.
IMPORTANT: Please actually put this data and put it into aspreadsheet and import it to matlab and include a screenshot of thematlab code you used to get the trendline, average, standarddeviation and shots made.

Location (Degrees
OR
OR
