when you plot, please use python
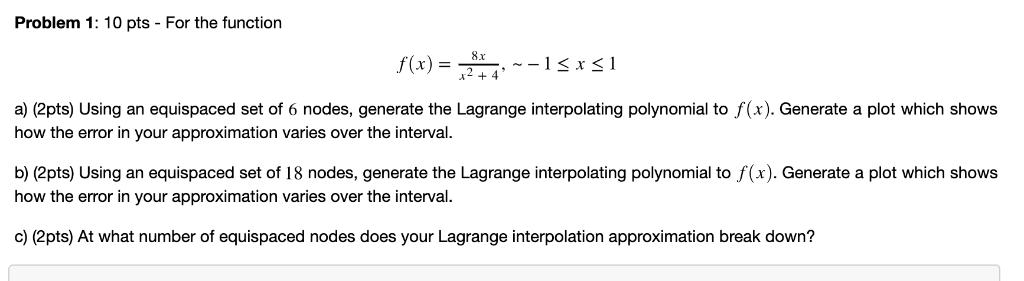
Problem 1: 10 pts – For the function 8 x a) (2pts) Using an equispaced set of 6 nodes, generate the Lagrange interpolating polynomial to f(x). Generate a plot which shows how the error in your approximation varies over the interval. b) (2pts) Using an equispaced set of 18 nodes, generate the Lagrange interpolating polynomial to f(x). Generate a plot which shows how the error in your approximation
OR
OR