#python
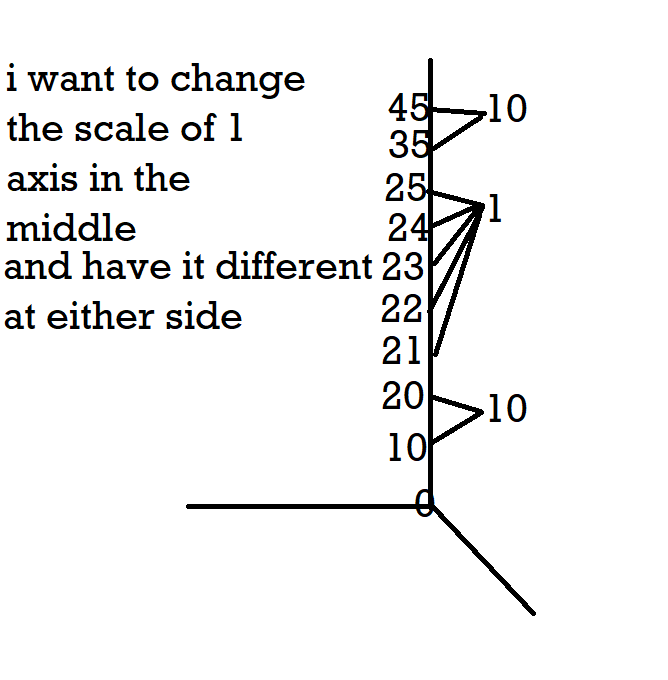
#i want to change the scale of my z axis like in thepicture
import matplotlib.pyplot as plt
import numpy as np
import math
from mpl_toolkits.mplot3d import Axes3D
a = np.linspace(50,200,50)
b = np.linspace(500,2000,50)
c = np.linspace(5,45,50) ### this is z
fig=plt.figure();
ax = fig.gca(projection=’3d’)
for i in c:
plt.plot(a,b,i)
#################################
fig.suptitle(r’title $theta$’, fontsize=20)
ax.set_xlabel(‘$X$’, fontsize=20, rotation=150)
ax.set_ylabel(‘$Y$’,fontsize=30)
ax.set_zlabel(‘Z’, fontsize=30, rotation=60)
#################################
plt.show()

i want to change 4510 the scale of 13 axis in the middle and have it different 23 at either side 24 21 2010 10 Show transcribed image text
OR
OR
