Using MATLAB_R2017a, solve the following question & plot theresults

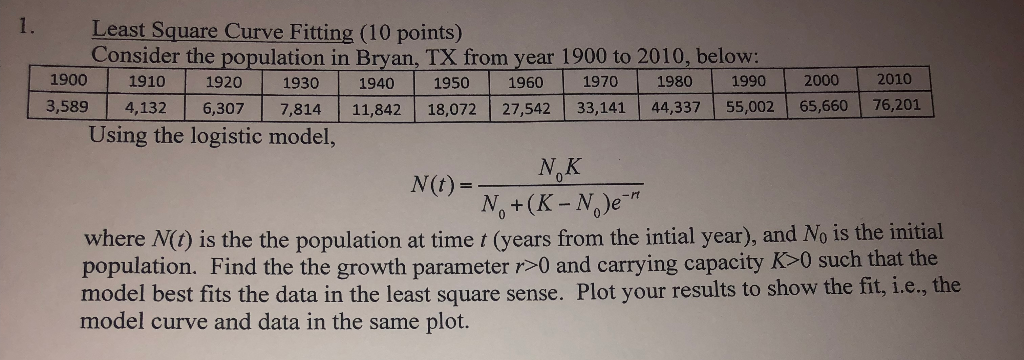
1. Least Square Curve Fitting (10 points) Consider the population in Bryan, TX from year 1900 to 2010, below 1900 1910 1920193019401950 1960 1970 1980 1990 20002010 3,589 4,132 6,307 7,814 11,842 18,072 27,542 33,141 44,337 55,00265,660 76,201 Using the logistic model, N(t) where N(t) is the the population at time t (years from the intial year), and No is the initial population. Find the the growth
OR
OR
