Write the Scilab code necessary to input data from an excelsheet and output a graph of this data.
Use the following as example. 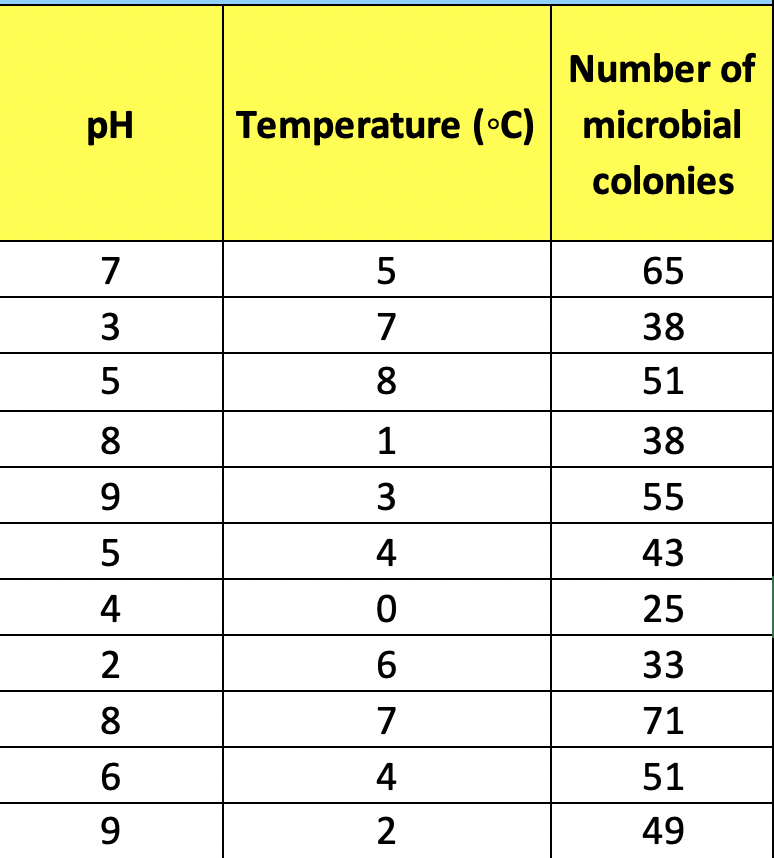
Number of pH Temperature (C) microbial colonies 65 38 51 38 9 43 25 0 6 71 51 49 6 9 Show transcribed image text Number of pH Temperature (C) microbial colonies 65 38 51 38 9 43 25 0 6 71 51 49 6 9
Solution